

Introduction
A sophisticated network automation dashboard was designed and developed to support large-scale telecom operations across multiple regions. It integrates automation frameworks and service coordination tools to manage bandwidth modifications, detect congestion, reroute traffic, and handle subscriber provisioning and migrations efficiently.
Core features include real-time congestion monitoring, intelligent traffic shifting between network interfaces, on-demand speed testing, and automated provisioning based on usage patterns. These functions help maintain optimal network performance and service stability at scale.
Upon joining the project, it became clear that the earlier designs lacked a user-centered approach. By engaging with actual users primarily managers, engineers, and business teams the design was realigned to address their problems, resulting in a more flexible, intuitive, and effective solution.
About Company
I worked on a project for Middle Eastern Telecom Company(METC), a leading multinational telecommunications provider based in the United Arab Emirates. Across Asia, the Middle East, and Africa, METC operates in 16 countries, and it is recognized as the 18th largest mobile network operator worldwide by subscriber base. As the sole network provider in the UAE, METC also serves as a major internet hub in the Middle East, offering critical connectivity to other telecom operators in the region.
This dashboard supports multiple automation processes, built using a combination of Global Technology Company (GTC) and METC components.
Project Overview
I worked on the EMIX Dashboard, a platform designed to optimize and manage METC’s network services.
Key features of EMIX include:
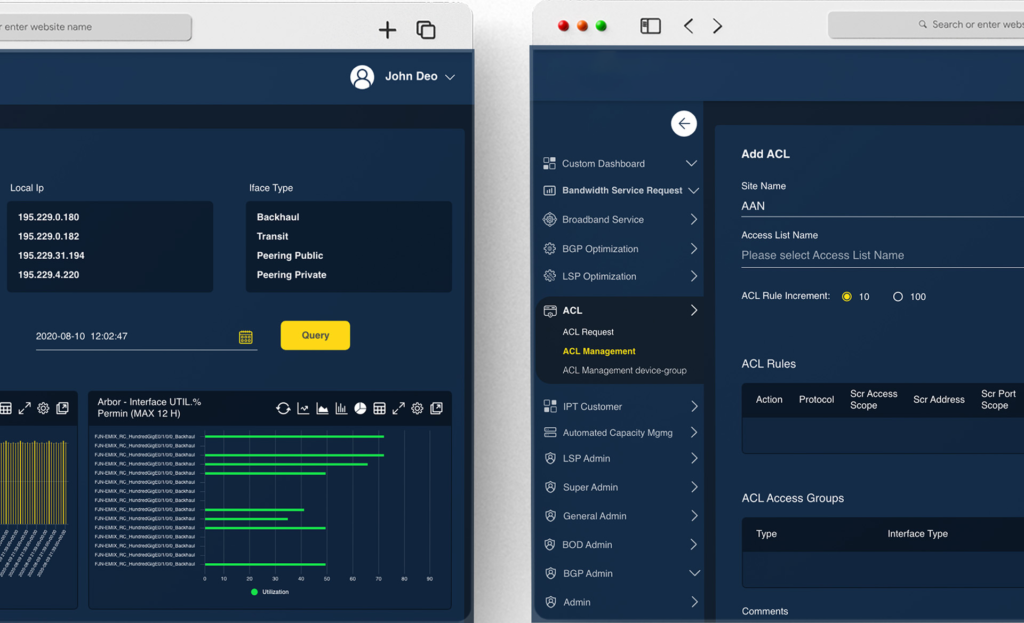
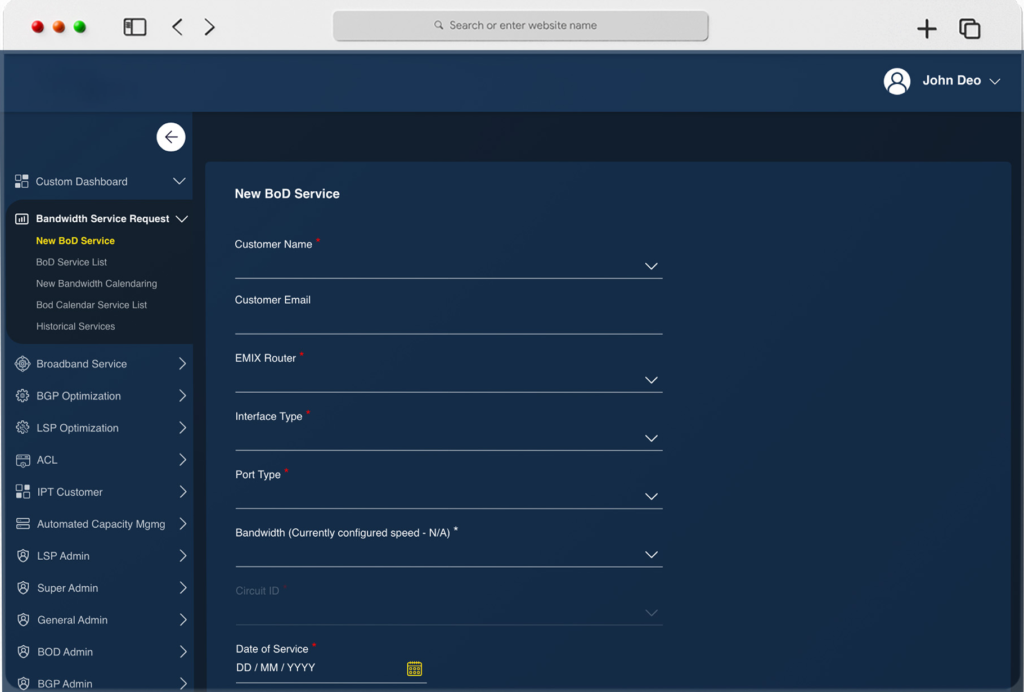
- Bandwidth Management: Modify bandwidth profiles for existing services using pre-defined speed packages.
- Congestion Detection & Traffic Optimization: Automatically identify overloaded BGP interfaces and shift traffic to healthy ones by re-routing prefixes.
- Network & LSP Monitoring: Detect congestion in the network and analyze which Label-Switched Paths (LSPs) are affected.
- Performance Optimization: Improve efficiency based on bandwidth utilization and delay analysis.
Some additional broadband (BB) features include:
- Provisioning of new internet packages across BNG routers and Alepo Radius.
- On-demand speed tests on BNGs using EXFO Worx and probes.
- Subscriber management, including bulk, single, and CSV-based migrations between internet packages.
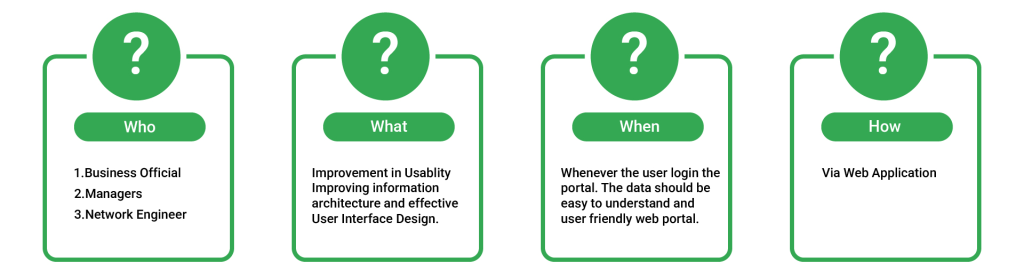
When I joined the team, the project was already underway with some boards in place. However, I noticed that many user pain points had not been addressed. My first step was to understand the users better the majority were METC business officials, managers, and engineers. This helped me identify key usability challenges, assess their flexibility with the development process, and ensure the product truly supported their needs.
Problem Statement
The primary challenge with the product was usability. The system generated large volumes of data from GTC and METC components, but the way this information was presented made it difficult to interpret and act upon. Both network engineers and business officials struggled to trace issues effectively through the dashboard. The most critical pain point was poor data representation, which created confusion instead of clarity.
Project Goals
A user-friendly web application with intuitive navigation and clear data representation, designed to improve usability and provide a seamless experience.
- Simplify the user experience by reducing complexity in how network data is presented.
- Ensure clarity in data representation to make insights actionable for both engineers and business officials.
- Provide intuitive tracking of issues through the dashboard to improve problem resolution time.
- Enhance data visualization to transform raw information into meaningful insights.
- Improve overall usability and accessibility, making the product effective for both technical and non-technical users.
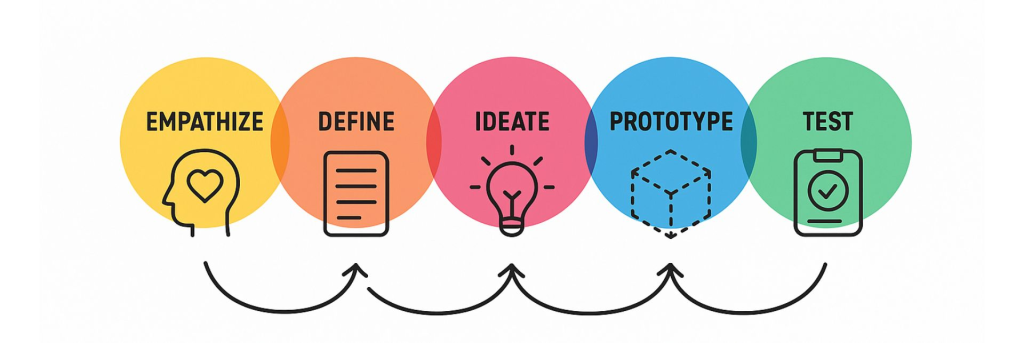
Design Process
Since the product was already live, we began with foundational research during the brainstorming phase. Once the design and prototype were ready, we conducted another round of research to validate usability. After launch, we carried out additional user research to confirm the design’s effectiveness and implemented post-launch improvements based on feedback. The process was both engaging and rewarding, leading to significant enhancements in the product.
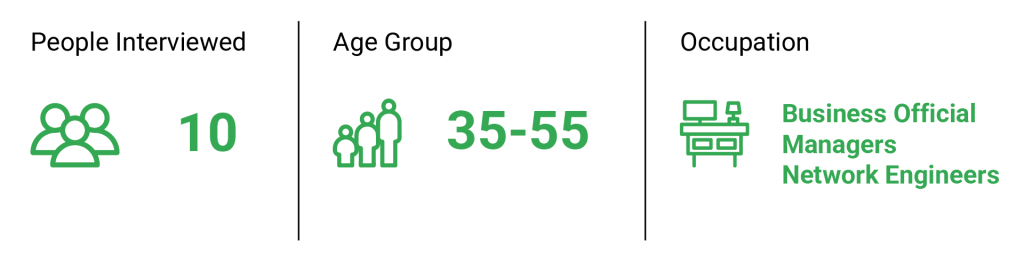
User Research
To ensure the dashboard addressed real user needs, we conducted interviews with key stakeholders, including business officials, managers, and network engineers.
During these sessions, we identified major pain points:
- Data Representation → Inconsistent presentation of multiple data streams from GTC and METC components caused confusion and inefficiency.
- Information architecture → The arrangement of data lacked structure, making it difficult for users to navigate and extract insights.
- User Interface Design → The dashboard followed separate branding guidelines (GTC vs. METC), resulting in a fragmented and non-standardized experience.
Based on these findings, our team prioritized restructuring the information architecture and standardizing data presentation to ensure clarity and usability. Only after solving these foundational issues did we move into refining the user interface design, aligning it with both functional needs and a unified visual identity.
This research driven approach allowed us to uncover root problems early and design solutions that truly improved usability for all types of users.
User Statements
After conducting the user interviews, we identified several recurring problem statements. The majority of users highlighted issues with data presentation and navigation within the portal. Some of the key problem statements included:
“Data arrangements are not proper.”
“Website navigation and getting the requirement is complicated.”
“Visual data is not appealing and is not managed as per the specific page.”
“The pages need to be arranged in such a way that we can easily navigate through it.”
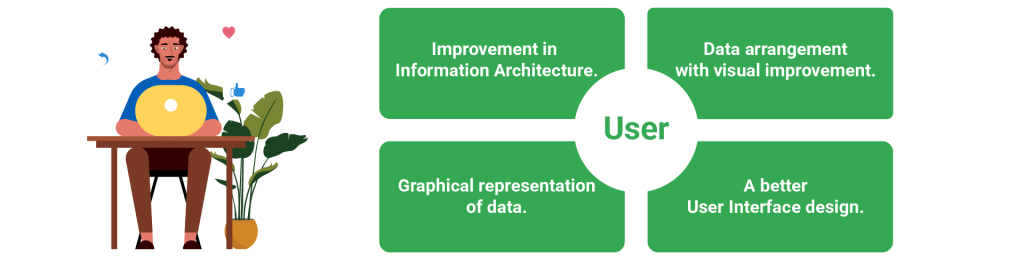
Core User Needs
After the analysis, we concluded that some core user needs must be addressed. A few essential user needs are mentioned below:
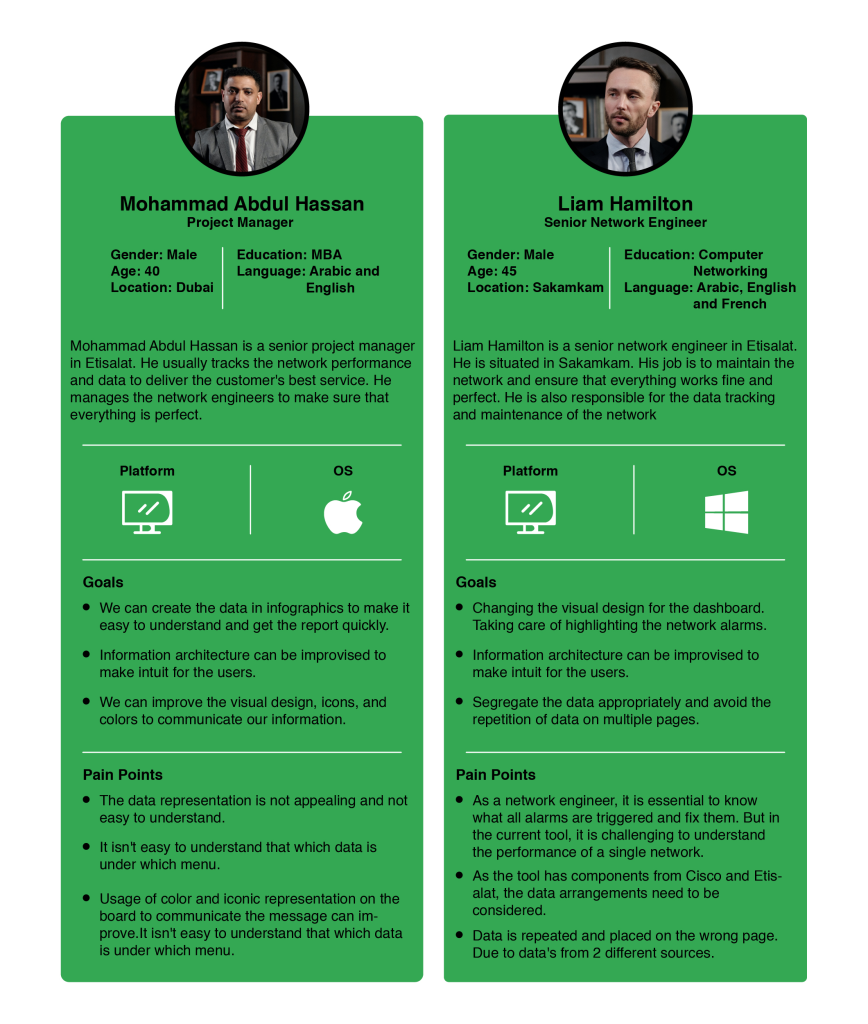
Persona
This tool was live and had active users, so we had an opportunity to interview the active users of the product. Here we will discuss two possible personas: Project Manager and Network Engineer.
User Interface Designs
Design Experience
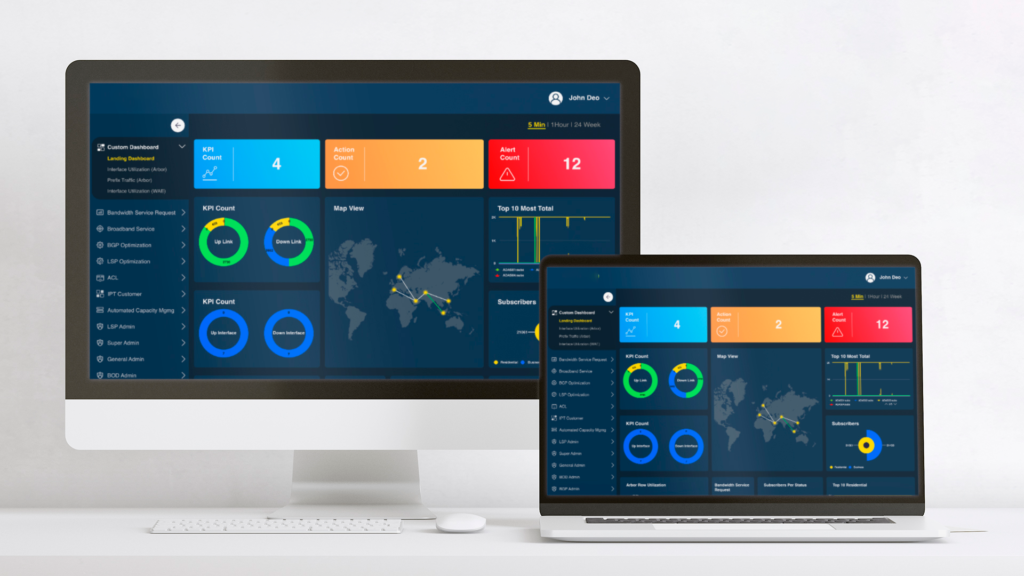
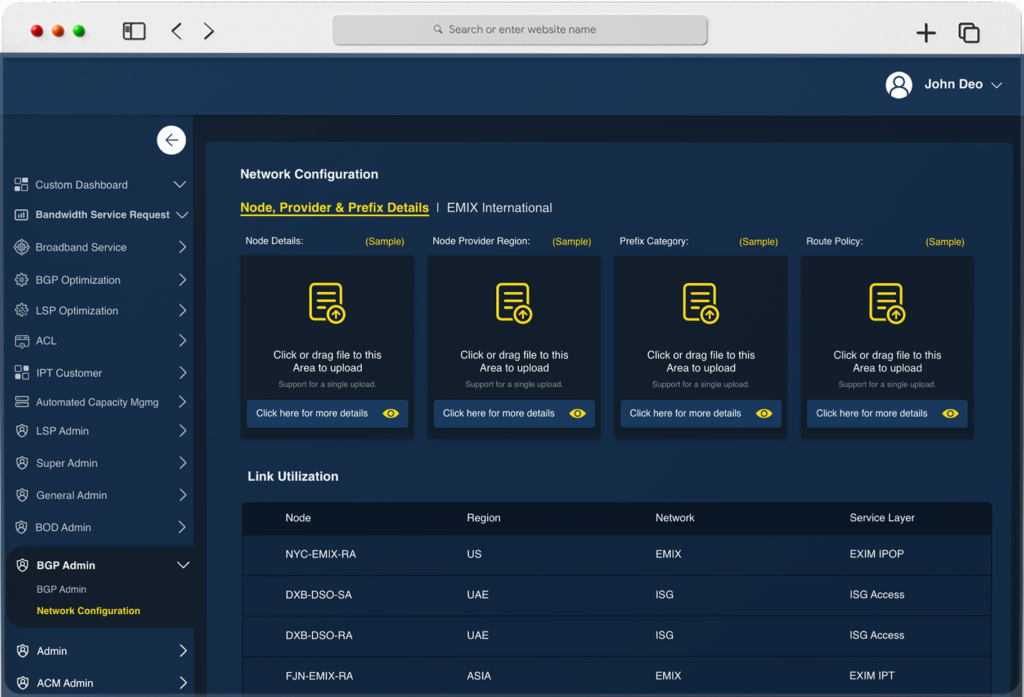
Capabilities
Keeping the users at the center, we designed and developed a desktop application that seamlessly integrates METC and GTC components in a unified and organized way. Based on research, I restructured the information architecture, making navigation intuitive and easy to follow. Standardized and enhanced data presentation with infographics, charts, and graphs allowed users to quickly interpret complex information. These improvements resulted in a user-friendly dashboard that supports clarity, consistency, and efficiency for managers, engineers, and business teams.
Design Challenges
Although this phase had relatively simple requirements, several important challenges had to be addressed during the design process:
Empathy Across Regions → Since the company operates in 16 different countries, interviewing users was logistically challenging. Scheduling across time zones and ensuring meaningful participation required careful coordination.
Designing for a Live Dashboard → The product was already live with active users, making it critical to balance improvements with ongoing functionality. Prioritizing which features to redesign, phasing them appropriately, and planning release timelines were complex decisions.
Design Development Alignment → The project reached the design team after initial development had begun, which created constraints. Some design decisions were difficult to implement technically, requiring close collaboration with developers to adapt and improve the existing build.
User Testing in Real-Time → With an active user base, testing and research were conducted directly in the live environment. This made problem-solving both exciting and challenging, as issues had to be fixed quickly without disrupting ongoing operations.
Research Planning → To keep research structured, we divided it into three stages: foundational research, iterative research during the design phase, and post-launch evaluation to stabilize and refine the dashboard.
Data Management and Segregation → The dashboard had to handle a vast amount of data from both METC and GTC systems. To address this, we created custom dashboards to better organize, segregate, and present the data effectively.
Post-Launch Research and Iteration → Continuous feedback after launch was crucial. Improving the design while working within the constraints of an active system presented challenges but also ensured the product evolved in line with user needs.
Key Takeaways
This project was a valuable learning experience, as I was involved end-to-end from research to client presentations. It reinforced the importance of placing design at the center of the product lifecycle, as both the client and users saw measurable improvements in performance, usability, and data accuracy.
The success of the dashboard led to extended post-launch research, opening new business opportunities for the team. It also highlighted a broader need to redesign legacy systems (10–12 years old) that were built without a focus on user experience, creating additional projects for internal dashboards.
Overall, this project strengthened my skills in user research, design–development collaboration, and stakeholder communication, while showing how thoughtful UX can transform traditional products into modern, effective tools.